
Workspace overview
Rewind's workspace is built around five regions. This page walks through each one and points you at the page that goes deeper.
Screenshot — Annotated regions of the workspace
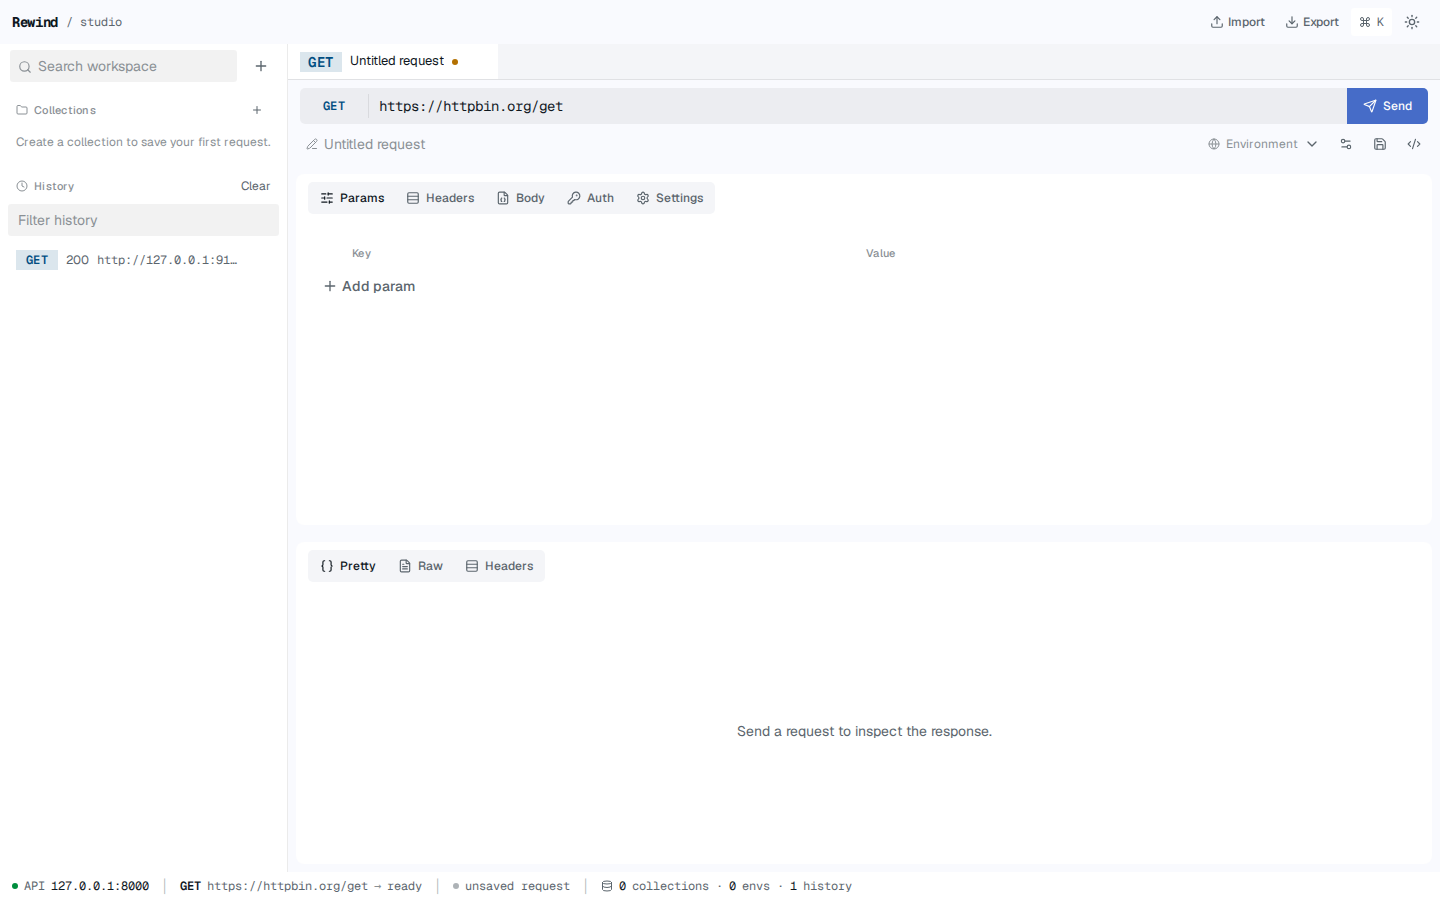
Top bar
The top bar holds global actions that don't belong to any one request.
- Rewind / studio wordmark on the left. Clicking it does nothing; it's just brand.
- Import opens the import dialog: OpenAPI 3, Postman v2, or restore a
.rewindbackup. - Export downloads the entire workspace as a single
rewind-workspace-YYYY-MM-DD.rewindarchive. - The command palette button (a small
Kchip) — orCtrl+K/Cmd+K— lists common actions you can run by typing a few letters. - The theme toggle switches between light and dark.
See Import and export for the full import flow.
Sidebar
The left sidebar is your library. It has two stacked sections:
- Collections — every collection you've created or imported, with their folders and requests nested inside. Use the search box at the top to filter by name or URL.
- History — every request you've sent, newest first, with the method, status, and URL. Use the filter input to narrow the list.
Drag and drop folders and requests inside a single collection to reorganize. Right-click (or use the kebab menu) to rename, duplicate, or delete.
The sidebar has its own page: Sidebar and tabs.
Request area
The middle region is where you build and inspect a single request. It is laid out as four horizontal strips, from top to bottom:
- Request tabs — one tab per open request, each prefixed with a color-coded method badge and a
×close button. A small dot on the tab means the request has unsaved changes. The active tab is filled; inactive tabs are dim. - URL bar — a two-row control. Row 1 is the method picker, URL input, and the Send / Cancel button. Row 2 is the request name field, the environment picker, and the action icons: a gear that opens the Environments sheet, a save icon, and the code generator icon.
- Request panel and Response panel stacked vertically, with a draggable divider between them. Each panel has its own tab strip.
Request panel
The request panel has five tabs. Every tab has an icon, a label, and — when there is something to show — a small inline count or sub-label (for example, "Body · JSON" or "Auth · Bearer"):
- Params — query parameters as a key/value table. The tab label shows the count of enabled rows.
- Headers — request headers as a key/value table. The tab label shows the count of enabled rows.
- Body — the request body editor. The sub-label reports the current mode (
None,JSON,XML,HTML,JS,Raw,Form,Multipart, orBinary). - Auth — authentication configuration. The sub-label reports the selected auth type (
None,Bearer,Basic,API key, orOAuth 2). - Settings — per-request timeout, redirect behavior, and a section for global network settings.
Each tab is documented in Authoring requests.
Response panel
The response panel's top strip is a compact header that always shows the status, duration, and size, plus Copy and Download icon buttons. When the request is in flight, the strip shows "Sending…"; when an error happened, a red strip with the message appears directly under the header.
Below the header are the body tabs:
- Pretty — formatted body, with syntax highlighting matched to the response
Content-Type(json,xml,html, etc.). - Raw — the unformatted response body.
- Preview — only shown for HTML and image responses. A sandboxed iframe or a centered image viewer.
- Headers — every response header as a table. The tab label shows the count of headers.
- Redirects — only shown when the request followed one or more
3xxresponses. The tab label shows the number of hops. Lists every hop.
Screenshot — Response panel with status, duration, and size chips in the header strip
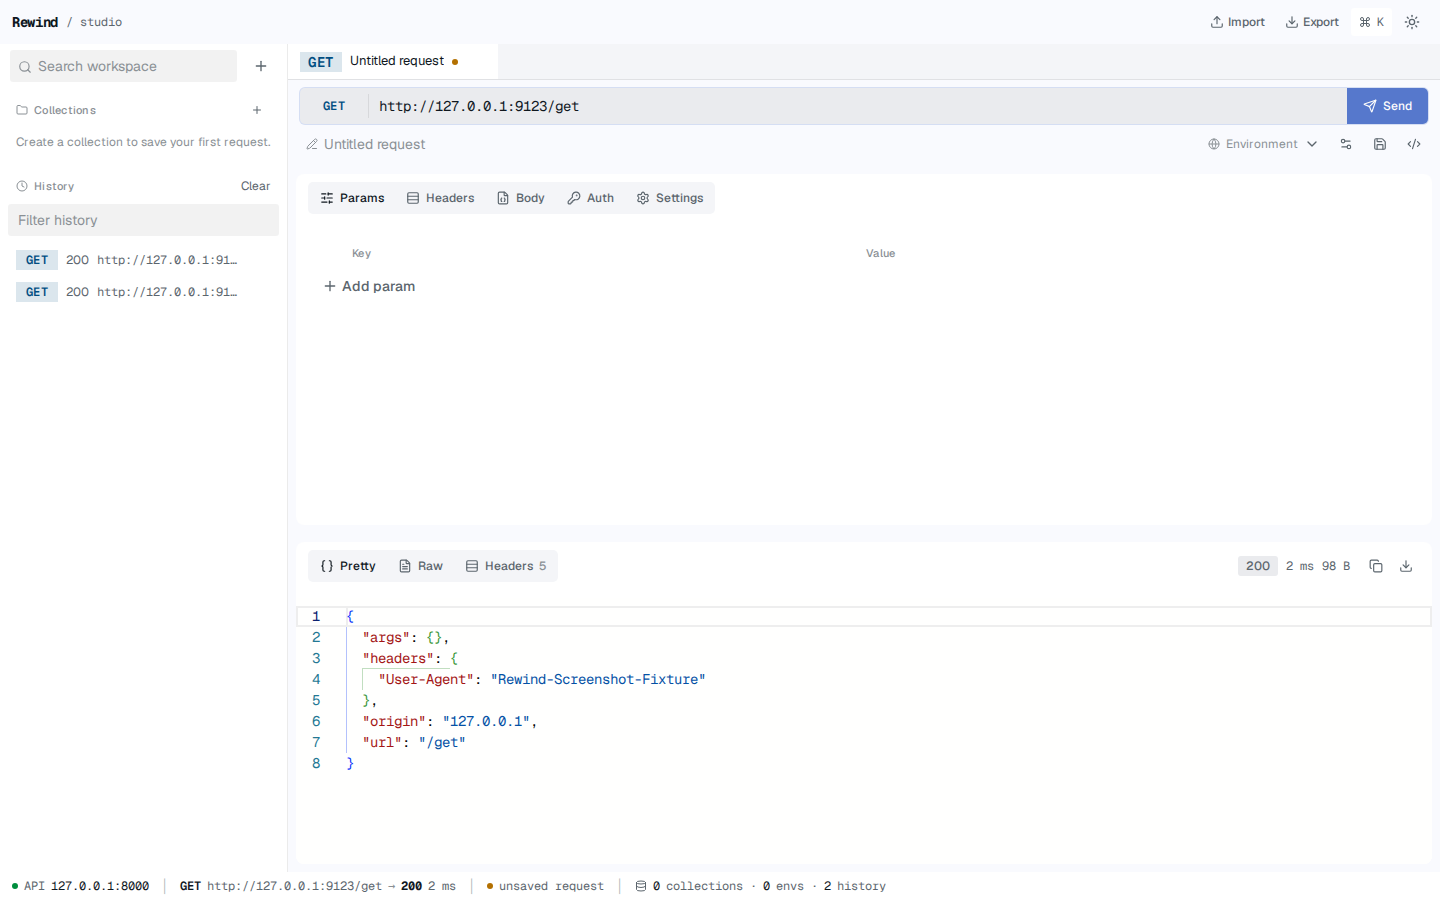
Status bar
The thin strip at the bottom shows four things at a glance, separated by dividers:
- API indicator — a green dot with
127.0.0.1:8000when the local backend is reachable. If the dot is red and won't clear, see Troubleshooting → Local session is not initialized and Sidebar is empty after restart. - Current request — the method, the truncated URL, and the last response status (or
runningwhile a request is in flight,readyif there has not been one yet). - Save state — a color-coded dot and a short label:
saving…,modified,saved,save conflict,save failed, orunsaved request. - Counts — the number of collections, environments, and history entries currently in memory.
Screenshot — Status bar
